(See the menu for other posts in this series.)
Am I in sync?
So now that we've configured NTP, how do we know it's working? As Limoncelli et. al. have said, "If you aren't monitoring it, you aren't managing it." There are several tools which can be used to monitor and troubleshoot your NTP service.
ntpq
ntpq is part of the NTP distribution, and is the most important monitoring and troubleshooting tool you'll use; it is used on the NTP server to query various parameters about the operation of the local NTP server. (It can be used to query a remote NTP server, but this is prevented by the default configuration in order to limit NTP's usefulness in reflective DDoS attacks; ntpq can also be used to adjust the configuration of NTP, but this is rarely used in practice.)
The command you'll most frequently use to determine NTP's health is ntpq -pn. The -p tells ntpq to print its list of peers, and the -n flag tells it to use numeric IP addresses rather than looking up DNS names. (You can leave off the -n if you like waiting for DNS lookups and complaining to people about their broken reverse lookup domains. Personally, I'm not a fan of either.) This can be run as a normal user on your NTP server; here's what the output looks like:
$ ntpq -pn
     remote           refid      st t when poll reach   delay   offset  jitter
==============================================================================
+172.22.254.1    172.22.254.53    2 u  255 1024  177    0.527    0.082   2.488
*172.22.254.53   .NMEA.           1 u   37   64  376    0.598    0.150   2.196
-192.189.54.17   130.95.179.80    2 u  338 1024  377   45.129   -1.657  18.318
+192.189.54.33   130.95.179.80    2 u  576 1024  377   32.610   -0.345   4.734
+129.127.40.3    210.9.192.50     2 u  158 1024  377   54.957   -0.281   3.400
-2001:4478:fe00: 216.218.254.202  2 u  509 1024  377   36.336    7.210   6.654
-103.38.121.36   203.35.83.242    2 u  384 1024  377   36.832   -1.825   7.134
-2001:67c:1560:8 145.238.203.14   2 u  846 1024  377  370.902   -1.583   3.784
-162.213.35.121  145.238.203.14   2 u  772 1024  377  328.477   -1.623  51.695
Let's run through the fields in order:
- remote
- The IPv4 or IPv6 address of the peer
- refid
- The IPv4 or IPv6 address of the peer's currently selected peer, or a textual identifier referring to the stratum 0 source in the case of stratum 1 peers.
- st
- The NTP stratum of the peer. You'll recall from previous parts of this series that the stratum of an NTP server is determined by the stratum of its time source, so in the example above we're synced to a stratum 1 server, therefore the local server is stratum 2.
- t
- The type of peer association; in the example above, all of the peers are of type unicast. Other possible types are broadcast and multicast; we'll focus exclusively on unicast peers in this series; see [Mills] for more information on the other types.
- when
- The elapsed time, in seconds, since the last poll of this peer.
- poll
- The interval, in seconds, between polls of this peer. So if you run ntpq -pn multiple times, you'll see the "when" field for each peer counting upwards until it reaches the "poll" field's value. NTP will automatically adjust the poll interval based on the reliability of the peer; you can place limits on it with the minpoll and maxpoll directives in ntp.conf, but usually there's no need to do this. The number is always a power of 2, and the default range is 64 (2^6) to 1024 (2^10) seconds (so, a bit over 1 minute to a bit over 17 minutes).
- reach
- The reachability of the peer over the last 8 polls, represented as an octal (base 8) number. Each bit in the reach field represents one poll: if a reply was received, the bit is 1; if the peer failed to reply or the reply was lost, it is 0. So if the peer was 100% reachable over the last 8 polls, you'll see the value 377 (binary 11 111 111) here. If 7 polls succeeded, then one failed, you'll see 376 (binary 11 111 110). If one failed, then 5 succeeded, then one failed, then another succeeded, you'll see 175 (binary 01 111 101) If they all failed, you'll see 0. (I'm not sure why this is displayed in octal; hexadecimal would save a column and is more familiar to most programmers & sysadmins.)
- delay
- The round-trip transit time, in milliseconds, that the poll took to be sent to and received from the peer. Low values mean that the peer is nearby (network-wise); high values mean the peer is further away.
- offset
- The maximum probable offset, in milliseconds, of the peer's clock from the local clock [RFC5905 s4], which ntpd calculates based on the round-trip delay. Obviously, lower is better, since that's the whole point of NTP.
- jitter
- The weighted RMS average of the differences in offsets in recent polls. Lower is better; this figure represents the estimated error in calculating the offset of that peer.
- tally
There's actually an unlabelled field right at the beginning of each row, before all the other information. It's a one-character column called the tally code. It represents the current state of the peer from the perspective of the various NTP algorithms. The values you're likely to see are:
- * system - this is the best of the candidates which survived the filtering, intersection, and clustering algorithms
- o PPS - this peer is preferred for pulse-per-second signalling
- # backup - more than enough sources were supplied and ntpd doesn't need them all, so this peer was excluded from further calculations
- candidate - this peer survived all of the testing algorithms and was used in calculating the correct time
- outlier - this peer includes the true time but was discarded during the cluster algorithm
- x falseticker - this peer was outside the possible range and was discarded during the selection (intersection) algorithm
- [space] - invalid peer; might cause a synchronisation loop, have an incorrect stratum, or might be unreachable or too far away from the root servers
Aside: the anatomy of a poll, and the selection (intersection) algorithm
t1 & t4 are recorded by the local system and are relative to its clock, t2 & t3 are recorded by the peer, and are relative to its clock. Here's a graphical representation, adapted from [Mills]:
 The total delay (the time taken for the request to get to and from the peer) is the overall time minus the processing time on the peer, i.e. (t4 - t1) - (t3 - t2). Because it can't know the network topology or utilisation between the local system and the remote peer, NTP assumes that the delay in both directions is equal, i.e. that the peer's reported times are in the middle of the round trip.
NTP performs the above calculation for every poll of every peer. When the results from peers are available, NTP runs the selection (or intersection) algorithm. The intersection algorithm is a modified version of an algorithm first devised by Keith Marzullo, and is used to determine which of the peers are producing possible reports of the real time, and which are not.
The intersection algorithm attempts to find the largest possible agreement about the true time represented by its remote peers. It does this by finding the interval which includes the highest low point and the lowest high point of the greatest number of peers. (Read that again a couple of times to make sure it makes sense.) This agreement must include at least half of the total number of peers for NTP to consider it valid.
If you forget everything else about NTP, try to remember the intersection algorithm, because it helps to make sense of NTP's best practices, which might otherwise seem pointless. There are various diagrammatic representations of the intersection algorithm around, including Wikipedia:
[caption id="" align="aligncenter" width="600"]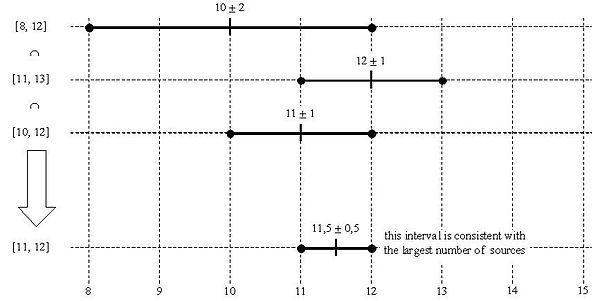 Marzullo's algorithm example from Wikipedia[/caption]
Or this one from Mills:
[caption id="" align="alignnone" width="374"] DTSS algorithm example from Mills[/caption]
But what started to make NTP click into place for me was this one from Deeths & Brunette in Sun's blueprints series:
[caption id="attachment_232" align="aligncenter" width="1188"] Intersection algorithm example from David Deeth & Glen Brunette - Sun Blueprints[/caption]
The intersection algorithm currently in use in NTPv4 is not perfectly represented by any of the above diagrams (since the current version requires that the midpoint of the round trip for all truechimers is included in the intersection), but they are useful nonetheless in helping to visualise the intersection algorithm.
Interpreting ntpq -pn
So let's look back at the example above and make a few observations about our ntpq -pn output:
- There are a couple of peers at the start of the list with RFC1918 addresses and very low delay (less than 1 ms). These are peers on my local network. The latter of these is a stratum 1 server using the NMEA driver, a reference clock which uses GPS for timing, but also includes a PPS signal for additional accuracy. (More on this time server in a later post.) Both of the LAN peers have missed a poll recently, but they're still reliable enough and accurate enough that they are included in the calculations, and the local stratum 1 server is the selected sync peer.
- There are four other peers with delays in the 30-60 ms range; these are public servers in Australia.
- Then there are two other peers with delays in the 300-400 ms range; these are servers in Canonical's network which I monitor; they live in our European data centres.
Note that all of these are still possible sources of accurate time - not one of them is excluded as an invalid peer (tally code space) or a falseticker (tally code x). We've also got pretty low jitter on most of them, so overall our NTP server is in good shape.
Other ntpq metrics
There are a couple more metrics of interest which we can get from ntpq:
- root delay - our delay, in milliseconds, to the stratum 0 time sources
- root dispersion - the maximum possible offset, in milliseconds, that our local clock could be from the stratum 0 time sources, given the characteristics of our peers.
- system offset - the local clock's offset, in milliseconds, from NTP's best estimate of the correct time, given our peers
- system jitter - as for peer jitter, this is the overall error in estimating the system offset
- system frequency (or drift) - the estimated error, in parts per million, of the local clock
Here's an example of retrieving these metrics:
$ ntpq -nc readvar 0
associd=0 status=0615 leap_none, sync_ntp, 1 event, clock_sync,
version="ntpd 4.2.6p5@1.2349-o Fri Jul 22 17:30:51 UTC 2016 (1)",
processor="x86_64", system="Linux/3.16.0-4-amd64", leap=00, stratum=2,
precision=-20, rootdelay=0.579, rootdisp=5.813, refid=172.22.254.53,
reftime=dbbeb981.38507158 Sat, Oct 29 2016 16:00:33.219,
clock=dbbeba0c.ae22daf2 Sat, Oct 29 2016 16:02:52.680, peer=514, tc=10,
mintc=3, offset=-0.102, frequency=6.245, sys_jitter=0.037,
clk_jitter=0.061, clk_wander=0.000
This tells ntpq to print the variables for peer association 0, which is the local system. (You can get similar individual figures for each active peer association; see the ntpq man page for details.)
Logging
It probably should go without saying, but if ntpq doesn't produce the kind of output you were expecting, check the system logs (/var/log/syslog on Ubuntu & other Debian derivatives, or /var/log/messages on Red Hat-based systems). If ntpd didn't start for some reason, you'll probably find the answer in the logs. If you're experimenting with changes to your NTP configuration, you might want to have tail -F /var/log/syslog|grep ntp running in another window while you restart ntpd.
Other monitoring tools
- ntptrace - we mentioned this in the previous post. It's rarely used nowadays since the default ntpd configuration prevents ntptrace from remote hosts, but can be helpful if you run a local reference clock which you've configured for remote query from authorised sources.
- ntpdate - set the time on a system not running ntpd using one or more NTP servers. This tool is deprecated (use ntpd -g instead), but it has one really helpful flag: -s (for simulate) - this does a dry run which goes through the process of contacting the NTP server(s), calculating the correct time, and comparing with the local clock, without actually changing the local time.
- /var/log/ntpstats/clockstats - this log file, if enabled, has some interesting data from your local reference clock. We'll cover it in more detail in a later post.
So those are the basic tools for interactive monitoring and troubleshooting of NTP. Hopefully you'll only have to use them when investigating an anomaly or fixing things if something goes wrong. So how do you know if that's needed?
Alerting
At work we use Nagios for alerting, so when I wanted to improve our NTP alerting, I went looking for Nagios plugins. I was disappointed with what I found, so I ended up writing my own check, ntpmon, which you can find at Github and Launchpad. The goal of ntpmon is to cover the most common use cases with reasonably comprehensive checks at the host level (as opposed to the individual peer level), and to have sensible, but reasonably stringent, defaults. Alerts should be actionable, so my aim is to produce a check which points people in the right direction to fix their NTP server.
Here's a brief overview of the alternative Nagios checks:
Some NTP checks are provided with Nagios (you can find them in the monitoring-plugins-basic package in Ubuntu); check_ntp_peer has some good basic checks, but doesn't check a wide enough variety of metrics, and is rather liberal in what it considers acceptable time synchronisation; check_ntp_time is rather strange in that it checks the clock offset between the local host and a given remote NTP server, rather than interrogating the local NTP server for its offset. Use check_ntp_peer if you are limited to only the built-in checks; it gets enough right to be better than nothing.
check_ntpd was the best of the checks I found before writing ntpmon. Use it if you prefer perl over python. Most of the remaining checks in the Nagios exchange category for NTP are either token gestures to say that NTP is monitored, or niche solutions.
Telemetry
For historical measurement and trending, there are a number of popular solutions, all with rather patchy NTP coverage:
collectd has an NTP plugin, which reports the frequency, system offset, and something else called "error", the meaning of which is rather unclear to me, even after reading the source code and comparing the graphed values with known quantities from ntpmon. It also reports the offset, delay, and dispersion for each peer.
The prometheus node_exporter includes NTP, but similar to check_ntp_time, it only reports the offset of the local clock from a configured peer, and that peer's stratum. This seems of such minimal usefulness as not to be worth storing or graphing.
Telegraf has a ntpq input plugin, which offers a reasonably straightforward interface to the data for individual peers in ntpq's results. It's fairly young, and has at least a couple of glaring bugs, like getting the number of seconds in an hour wrong, and not converting reachability from an octal bitmap to a decimal counter.
Given the limitations of the above solutions, and because I'm trying to strike a balance between minimalism and overwhelming & unactionable data, I extended ntpmon to support telemetry. This is available via the Nagios plugin through the standard reporting mechanism, and as a collectd exec plugin. I intend to add telegraf and/or prometheus support in the near future.
Here's an example from the Nagios check:
$ /opt/ntpmon/check_ntpmon.py
OK: offset is -0.000870 | frequency=12.288000 offset=-0.000870 peers=10 reach=100.000000 result=0 rootdelay=0.001850 rootdisp=0.032274 runtime=120529 stratum=2 sync=1.000000 sysjitter=0.001121488 sysoffset=-0.000451404 tracehosts= traceloops=
And here's a glimpse of the collectd plugin in debug mode:
PUTVAL "localhost/ntpmon-frequency/frequency_offset" interval=60 N:12.288000000
PUTVAL "localhost/ntpmon-offset/time_offset" interval=60 N:-0.000915111
PUTVAL "localhost/ntpmon-peers/count" interval=60 N:10.000000000
PUTVAL "localhost/ntpmon-reachability/percent" interval=60 N:100.000000000
PUTVAL "localhost/ntpmon-rootdelay/time_offset" interval=60 N:0.001850000
PUTVAL "localhost/ntpmon-rootdisp/time_offset" interval=60 N:0.036504000
PUTVAL "localhost/ntpmon-runtime/duration" interval=60 N:120810.662998199
PUTVAL "localhost/ntpmon-stratum/count" interval=60 N:2.000000000
PUTVAL "localhost/ntpmon-syncpeers/count" interval=60 N:1.000000000
PUTVAL "localhost/ntpmon-sysjitter/time_offset" interval=60 N:0.001096107
PUTVAL "localhost/ntpmon-sysoffset/time_offset" interval=60 N:-0.000451404
PUTVAL "localhost/ntpmon-tracehosts/count" interval=60 N:2.000000000
PUTVAL "localhost/ntpmon-traceloops/count" interval=60 N:0.000000000
This post ended up being pretty long and detailed; hope it all makes sense. As always, contact me if you have questions or feedback.
Read on in part 5 - myths, misconceptions, and best practices.
Related posts
- The School for Sysadmins Who Can't Timesync Good and Wanna Learn To Do Other Stuff Good Too, part 2 - how NTP works
- The School for Sysadmins Who Can't Timesync Good and Wanna Learn To Do Other Stuff Good Too, part 1 - the problem with NTP
- telegraf support for NTPmon
- NTP talks
- The School for Sysadmins Who Can't Timesync Good and Wanna Learn To Do Other Stuff Good Too, part 3 - NTP installation and configuration